A New Analysis of the Audiology Workforce, Benchmarked to Other Healthcare Professions
Victor Bray, MSC, PhD, FNAP & Amyn M. Amlani, PhD, FNAP
Introduction
The primary role of audiology is to assess hearing status, diagnose auditory and balance system disorders, and provide treatment to patients with hearing and vestibular problems. The objective of audiological care is to provide professional services—augmented by advancements in technology offerings—that are accessible and meet the demands of consumers in improving their quality of life (QoL). The responsibility of the profession, then, is to make certain it generates a dynamic, balanced, and viable supply of professionals (i.e., workforce) that can service the hearing healthcare needs of its population.
The assessment of this responsibility is complex, and includes such factors as evaluating the educational pipeline, assessing job satisfaction to minimize pre-mature professional attrition, and appraising the current workforce. The purpose of the present undertaking is to provide the reader with our ongoing research efforts in analyzing workforce trends, over time, (i) within audiology, and (ii) between audiology in comparison to other healthcare occupations (i.e., benchmark). Our purpose is driven by the intended objective of understanding how past historical audiology workforce trends impact the future of the profession as a function of the population it aims to serve, and as future service delivery models evolve.
To achieve our purpose and intent, we utilize a US government database that provided historical data. Specifically, the Bureau of Labor Statistics (BLS) created an occupational code for Audiology that was separate from Speech-Language Pathology starting in 1999.1 In this paper, we provide the reader with an overview of our previous effort that evaluated the audiology profession between 1999 and 2019, and provide a new analysis, based on statistical modeling, representing the last 10-years (2012-2021). BLS employment data are also available for other healthcare professions for the same 10-year span, to which we benchmark the health of the audiology workforce.
It is important that the reader understand the application, and potential misapplication, of the data presented in this paper. The importance of the BLS Occupational Employment and Wage Statistics database is that it provides a comprehensive historical record of the American workplace. We use the data for the evaluation of long-term trends to facilitate projections of the future. The intent of this data is not to establish the current size of the workforce. For example, the BLS Occupational Outlook Handbook page for Audiology says that there are 14,600 jobs in 2021.2 In contrast, the BLS page for Audiology reports employment of 13,240 in 2021, with a footnote that “Estimates do not include self-employed workers.”3
In discussions with leadership of the major audiology organizations, the 14,600-workforce number seems to be a more appropriate estimate of the current workforce size. But understand we are using the number of 13,240 in 2021 as it is part of a long-term historical data set from which trends, such as 10- and 20-year growth rates, can be determined.
Benchmarking Across Professions
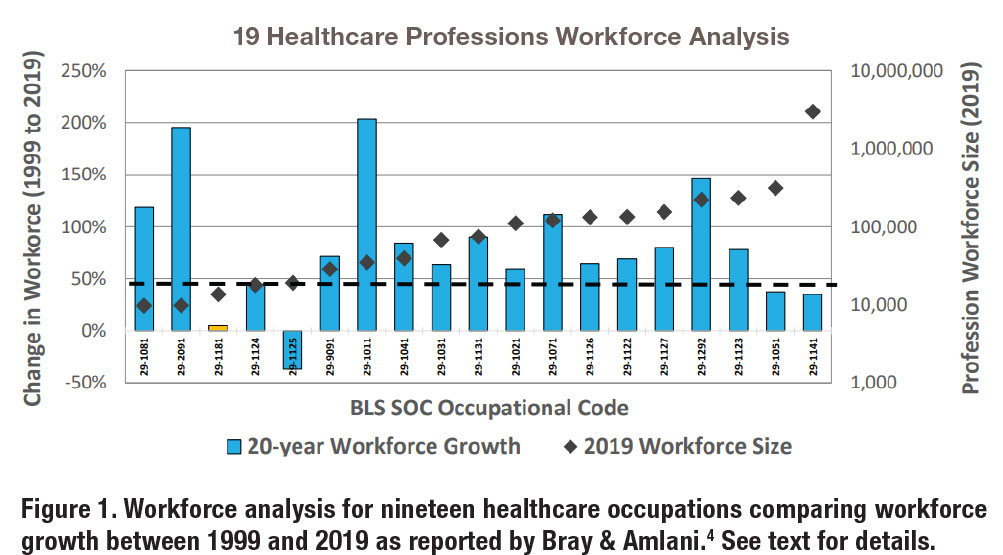
Our previous work on the Audiology workforce, presented in 2021,4 resulted in an analysis of nineteen healthcare professions using BLS data between 1999 and 2019.5 The results of the analysis are shown in Figure 1. The blue bars shown in the figure highlight the percentage growth in employment (on the y-axis [ordinate]) between 1999 (reference year) to 2019 (current BLS data) as a function of nineteen occupations. Percentage growth was determined as the difference between the reference year (1999) and the most recent year (2019). Furthermore, the black diamonds displayed in the figure captures the size of the occupational workforce reported in 2019 and are referenced to the right ordinate (i.e., z-axis).
The orange bar (third from the left, BLS Code 29-1181), displayed in Figure 1, represents Audiology. In comparison, the three occupations showing the highest 20-year growth rates were Orthotists and Prosthetists at 195% (BLS Code 29-2091), Chiropractic at 203% (BLS Code 29-1011), and Dental Hygienists at 146% (BLS Code 29-1292). The two occupations showing the lowest growth rates were Audiology at 5% (BLS Code 29-1181) and Recreational Therapists at negative 37% (BLS Code 29-1125).
An updated workforce analysis is provided in this paper. In the new analysis, we first expand the number of healthcare occupations from nineteen to thirty-one.6 These thirty-one professions were sorted by the degree requirement: Associate, Bachelor’s, Master’s, or Doctorate. Second, the time frame was reduced from twenty years (1999 – 2019) to ten years (2012 – 2021), supporting a focus on more recent data trends. In addition, the calculation of percent change in the workforce was not based on the simple difference between the base year (2012) and the most recent year (2021), but instead on linear regression modeling utilizing annual workforce numbers across the decade of data for each occupation.
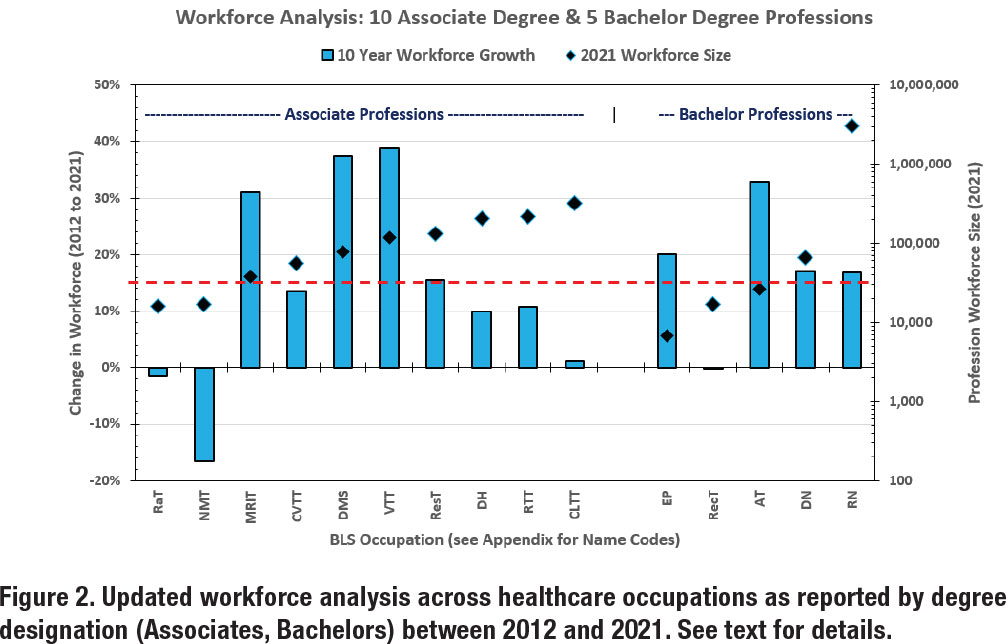
The results are shown in Figures 2 and 3. Similar to our previous work, the blue bars represent the change in workforce growth (10 years) referenced to the left ordinate (i.e., y-axis). Likewise, the black diamonds represent the workforce size of the occupation in 2021 referenced to the right ordinate (i.e., z-axis). In Figure 2, the left side displays growth rate for ten Associate’s degree professions and the right side shows the growth rate for five Bachelor’s degree professions. The dashed red line provides a reference of 15% growth rate, which was the mean growth rate combined across the fifteen occupations.
In Figure 3, the left side exhibits the growth rate for eight Master’s degree professions and the right side reveals the growth rate for eight Doctoral degree professions. The dashed red line serves as a reference for the 32% mean growth rate combined across the sixteen occupations.
The outcomes from these analyses showcase several emerging trends. In Figure 2, three of the Associate’s degree professions had large growth rates from 2012 to 2021: Magnetic Resonance Imaging Technologists (MRIT) at 31%, Diagnostic Medical Sonographers (DMS) at 37%, and Veterinary Technologists and Technicians (VTT) at 39%. Two of the Bachelor’s degree professions had large growth rates: Exercise Physiologists (EP) at 20% and Athletic Trainers at 33%. In Figure 3, two of the Master’s degree professions had very large growth rates: Physician Assistants (PA) at 59% and Nurse Practitioners (NP) at a remarkable 123%. The Doctoral degree profession with the largest growth rate was Veterinarians at 36%.
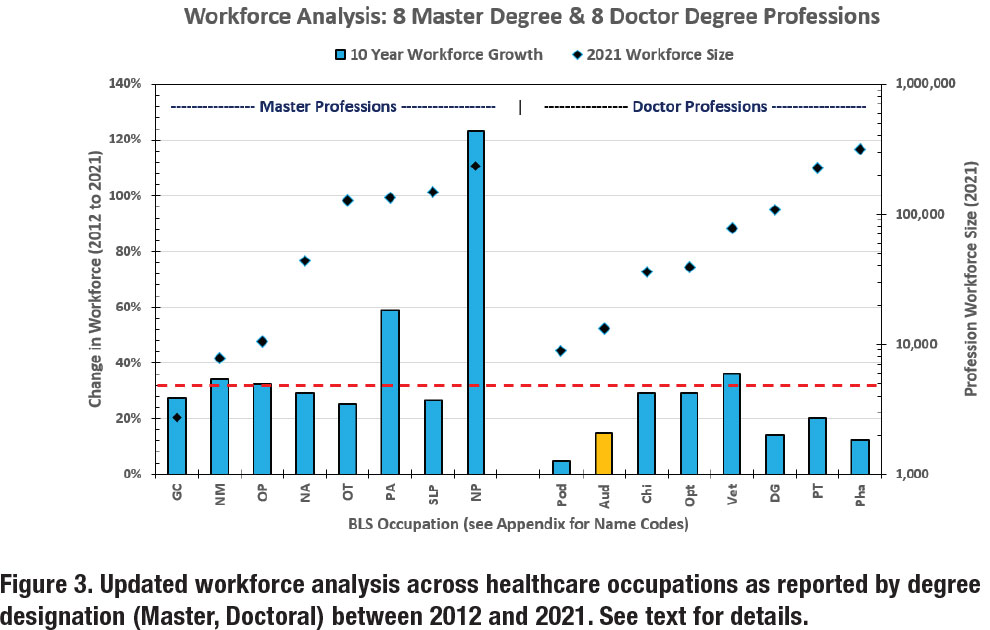
On the flipside, Figure 2 shows that three of the Associate degree professions did not have significant growth: Radiation Therapists (RaT) at negative 2%, Nuclear Medicine Technologists (NMT) at negative 17%, and Clinical Laboratory Technologists and Technicians (CLTT) at 2%. Among the Bachelor’s degree professions, Recreational Therapists (RT) growth rate was 0%. In Figure 3, all the Master’s degree professions grew at rates of 25% or greater. In the Doctoral degree professions, the growth rate of Podiatry (Pod) was lowest at 5%. The growth rate for Audiology (orange bar, AuD) was 15%.
Several important observations can be made from these data. First, there are different occupational growth rates for the four-degree groups: 14% for Associate’s, 17% for Bachelor’s, 45% for Master’s, and 20% for Doctoral. Second, growth of an occupation’s workforce is not guaranteed as growth rates were nominal for RaT, CLTT, and RecT and negative for NMT. Third, explosive growth rates can occur. For example, NP entered the BLS database in 2012 with a workforce of 105,780 and grew to 234,690 by 2021. Fourth, the Master’s degree group shows the best overall performance in terms of occupational growth rate, suggesting that these professions, in general, are successful in filling, and even growing, their occupational niche. Fifth, this new analysis reveals a growth rate for Audiology of 15% over ten years, which is in marked contrast to the growth rate of 5% over twenty years that was reported in our prior (i.e., 2021) analysis. This last observation is the basis of the next section in this paper.
Analysis of Audiology Growth
In our 2021 analysis, Bray and Amlani initially reported a 5% change in the Audiology occupational workforce between 1999 and 2019 (see Figure 1). A subsequent linear regression analysis in the same paper was performed—shown in Figure 4—across the twenty-year data that revealed a slope of 94—representing the annual growth in the workforce—and a twenty-year growth rate of 18%.
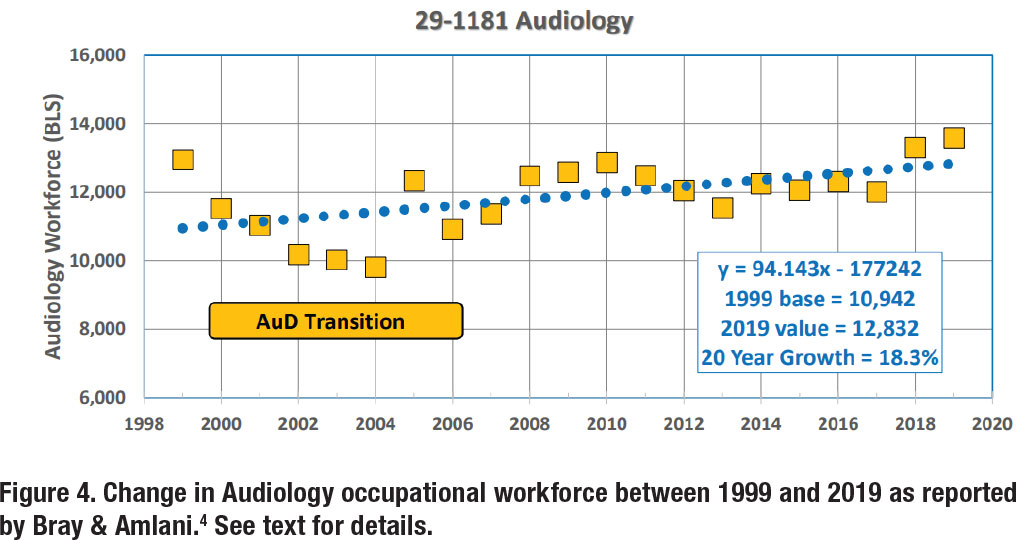
In re-examining our 2021 analysis, we conclude that there is an aberration in the audiology workforce data that we would like to remove from the analysis. From 1999 to 2004, note the negative trend in workforce, followed by positive trend starting in 2005. Regarding Figure 4, we remarked that, “The data show a 24% decline from 12,950 in 1999 to a low of 9,810 in 2004, which coincides with the transition from the Master’s degree to the Doctoral/Professional degree requirement.”
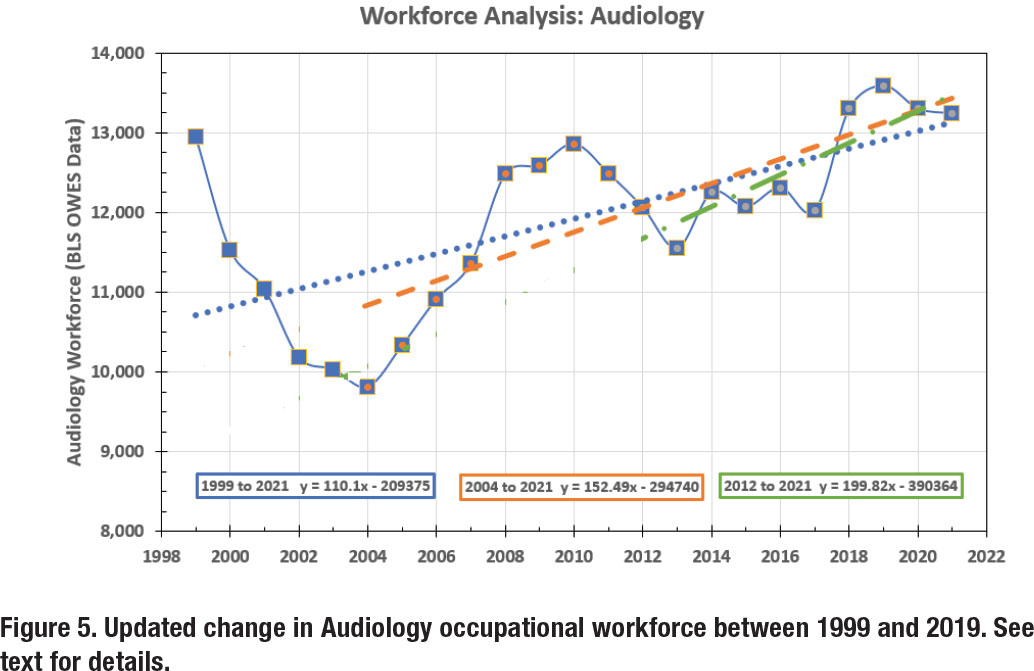
Our current analysis, which is more robust, is shown in Figure 5, and considers Audiology workforce data between 1999 and 2021. The annual workforce numbers are denoted by the solid blue line. Here, the occupational workforce loss and recovery between 1999 and 2010 can clearly be seen.
At first glance, the workforce picture is alarming, with a workforce size of 12,950 in 1999 and 13,240 in 2021, for a net growth of 290 audiologists over a 22-year period, or a workforce growth rate of 13 audiologists per year (i.e., [13,240 minus 12,950]/22). But, given the dramatic changes in the year-to-year numbers, a more robust (and accurate) analysis includes the use of linear regression modeling. Using a regression model over the 22-year span (denoted by the blue dotted line) yields a slope of 110.1, indicating that the audiology workforce was growing at a rate of 110 persons per year during this period. In contrast, an analysis from the lowest point—in 2004—to the present (i.e., most recent seventeen years, represented by the dashed orange line) yields a slope of 152.5, or a workforce growth rate of 153 persons per year. Alternatively, an analysis using the most recent decade (i.e., 2012 – 2021, which is denoted by the dash-dot green line) yields a slope of 199.8, or a workforce growth rate of 200 audiologists per year.
So, what is the ‘right answer’ for the Audiology workforce growth: 13, 110, 153, or 200 audiologists per year? We now believe that the best answer is to use the most recent 10-year data as it represents current conditions and eliminates the abnormal drop and recovery associated with the AuD transition process between 1999 and 2010. This growth rate of 200 audiologists per year is the highest value, and most optimistic picture, that we have reported in our ongoing ‘Analysis of the Audiology Profession’ project that began in 2019.
A “What If” vs “What Is” Scenario for Audiology
Another analysis of the profession that deserves attention is the ‘what if’ scenario. Specifically, ‘what if’ the Audiology workforce had not lost over 3000 jobs (almost 25% of the workforce) from 1999 to 2004? ‘What if’ Audiology had grown at the same rate as similar professions from 1999 to 2021 (e.g., OT at 62%, PT and SLP at 72%, and Optometry at 81%)?
Applying a benchmark growth rate of 72%—the average workforce growth rate of OT, PT, SLP, and Optometry— onto the 1999 Audiology workforce baseline, the profession would have increased to a workforce of slightly more than 22,000. This outcome would have yielded a workforce of an additional 9,000 Audiologists beyond the 2021 BLS reported workforce of 13,000. A preliminary conclusion from this analysis is that the Au.D. transition process to a doctoral-level profession contributed to an opportunity cost that markedly depreciated the long-term workforce numbers (i.e., 9,000 jobs by 2021), and that ripple effect is still being felt by the profession.
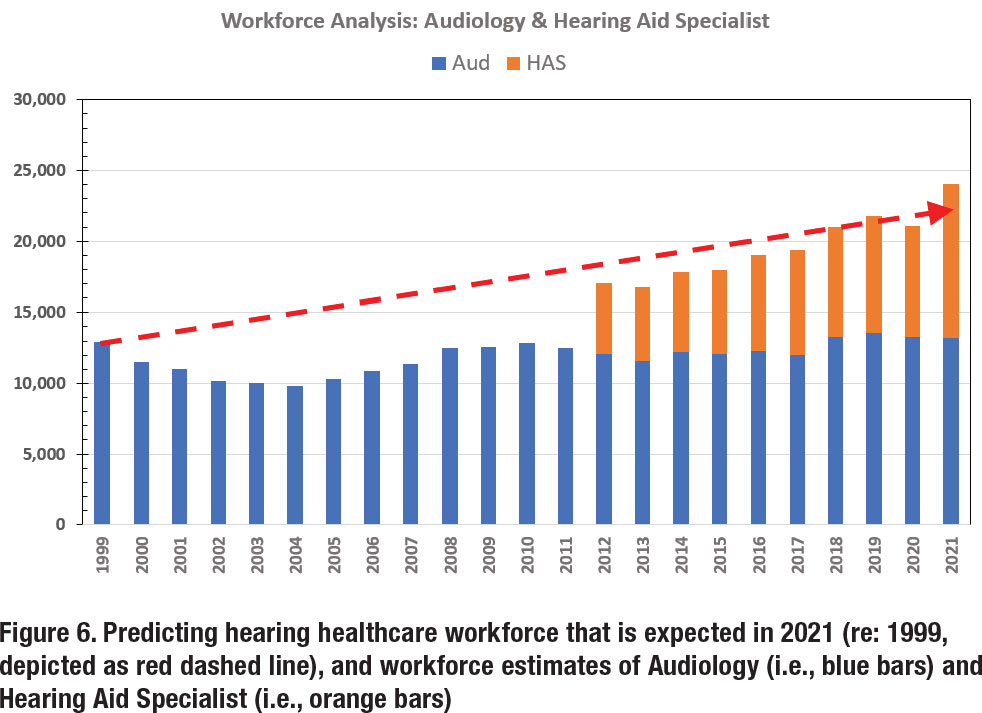
The resulting opportunity cost begs the question, who is doing the work of 9,000 audiologists to meet the hearing healthcare needs of the US population? To answer this question, we, again, access the BLS database. As previously mentioned, in 2012, BLS expanded its database and added several professions and included Hearing Aid Specialist (HAS). In 2012, BLS reports the HAS workforce to be 4,980. In 2021, the HAS workforce number is reported at nearly 11,000. This means that during the last decade—while the Audiology workforce grew 15%—the HAS workforce grew by greater than 100%. The impact of this doubling in HAS workforce is displayed in Figure 6, as denoted by the orange bars. When we aggregate the workforce numbers for the hearing care segment, the effect of combining professions (i.e., Audiology + HAS) closely answers the ‘what if’ scenario asked at the outset of this section.
The ‘what is’ scenario is currently being played out before our eyes. Specifically, the HAS scope of practice continues to expand—albeit with guidance from prominent audiologists aiding industry corporations in leveraging increased marketshare—to lessen the gap when it comes to serving the demand of US consumers in need of hearing health services. HAS are closing the gap on (i) the dispensing of hearing aids, (ii) the provision of services and technology related to tinnitus, (iii) the management of comorbidities (such as falls) by the introduction of healthable technologies, and (iv) screening for comorbidities and disabilities that may be associated with untreated hearing loss (when there is a profit motive such as cognitive screening). Putting this into perspective, we refer to the adage: While there may be ‘no free lunch,’ it certainly appears that the HAS profession is eating Audiology’s lunch!
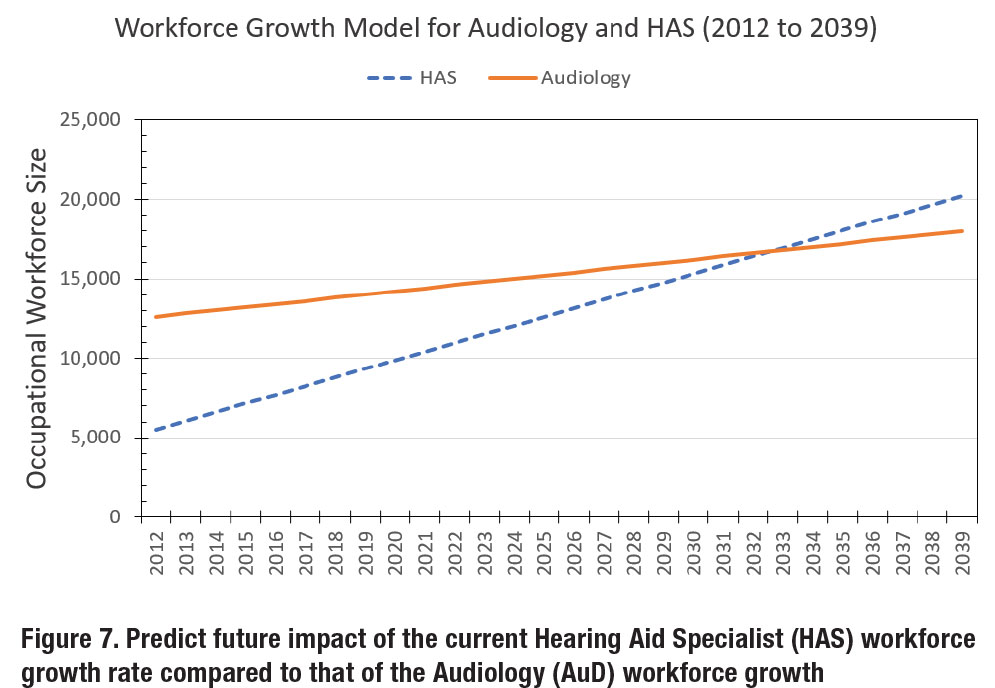
Lastly, Figure 7 was constructed to predict the future impact of the current HAS workforce growth rate compared to that of the Audiology workforce growth. In the figure, Audiology is represented by the solid orange line and HAS is denoted by the dashed blue line. Note that the modeling predicts that that the HAS workforce will intersect (i.e., equal value) and surpass the AUD workforce around 2033, unless something changes for the two professions that alters their respective workforce growth rates.
Projections of Future Needs
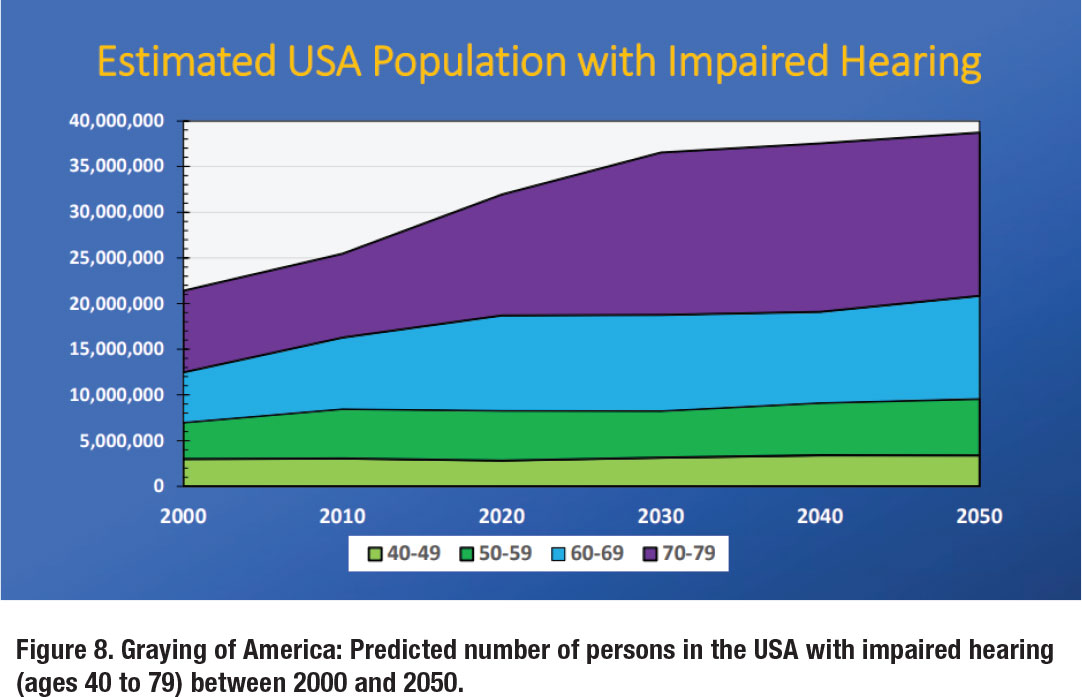
This workforce analysis would not be complete without a discussion on the population that is being served. Figure 8 represents the predicted number of persons in the USA with impaired hearing (ages 40 to 79) between 2000 and 2050.7 The figure was created by determining the US population as a function of age group by decade, which was multiplied by coefficients provided by Mener and colleagues8 that estimates the percentage of individuals with hearing loss by age group.
Results from this analysis clearly show the Graying of America, where the number of hearing-impaired people aged 40-49 increase from nearly 3 million to 3.4 million between 2000 and 2050, while the number of hearing-impaired people aged 70-79 double from 8.9 million to 17.9 million during the same period. Overall, the hearing-impaired US population—aged 40-79 years—is expected to increase from 21.4 million in 2000 to 38.7 million in 2050.
In this modeling, in 2000, the ratio of audiologists to adult hearing loss was about 1:1,646 (21.4 million/13,000). This ratio increased markedly to 1:2,283 in 2030 (36.5 million/16000) given the marked rise in the adult hearing-impaired population, and slightly decreases in 2050 to an estimated 1:1,935 (38.7 million/20,000; Audiology inferred taken from data used in Figure 7). Clearly, the future success and viability of our profession and our scope will hinge on whether we can grow our workforce to match accelerating population demands, particularly between now and 2030.
Final Thoughts
The purpose of this paper was to provide our colleagues in the Academy of Doctors of Audiology (ADA) with insights with respect to the Audiology workforce. The positive message is that Audiology, with a renewed and robust analysis, seems to be onpar with BLS projections for its growth. Specifically, our report of 15% workforce growth over the last decade is in line with the BLS Occupational Outlook Handbook, Audiologists Job Outlook (2021-2031) of 10% projected change in employment.
Despite this piece of good news, there remain several problems. There is an opportunity cost associated with the transition to a doctoral-level profession that continues to impact the profession negatively (estimated at 9,000 in 2021), and that must be addressed to meet the needs of the ballooning growth of older Americans with hearing loss. In addition, the 15% growth rate over ten years is not on par with growth rates of similar professions such as OT (25%), PT (20%), SLP (26%), and Optometry (29%). This begs the question, ‘Why Not’, and will be a topic of future publications in this series.
Nationally, the ongoing shortage in Audiology workforce is being offset by rapid growth in HAS workforce. Their expanding workforce and expansion of scope of practice will continue as HAS foresees themselves as the primary profession that is serving the consumer with hearing loss, including all related services that can be provided through selling of multi-function, prescription hearing aids. Like-it-or-not, the viability and sustainability of Audiology is being challenged and the scope of practice is being slowly encroached.
Lastly, we strongly believe that our conclusions are indicative of the professional workforce and its challenges. However, the reader should be aware that there exist several other databases that could provide a different set of values and, correspondingly, different estimates than what is presented in this paper. In addition, we hope that the reader will understand that our intent is not to attack our profession, but through benchmarking which can identify best practices, identify both weakness in our current situation and possible solutions from other healthcare professions, especially those that have the Master’s or Doctoral/Professional degree as the entry requirement to practice. ■
References
- Prior to 1999 Speech-Language Pathology and Audiology shared the occupational code of 32314.
- https://www.bls.gov/ooh/healthcare/audiologists.htm#
- https://www.bls.gov/oes/currenT/oes291181.htm
- Bray & Amlani (2021). Historical Trends in US Audiology Workforce, Benchmarked to Other Healthcare Professions. Poster presented at AAA Convention, April, Virtual.
- Several healthcare occupations that in later sections of this paper were not in the BLS database for the years 1999 - 2019.
- In 2012, BLS expanded their system to add several healthcare professions that were not previously in the database.
- Bray & Amlani (2022). Analysis of Audiology and the (4-Year) Au.D. Degree. Presentation at ASHA Convention, November, New Orleans, LA.
- Mener DJ, Betz J, Genther DJ, Chen D, Lin FR. (2013). Hearing loss and depression in older adults. J AM Geriatric Soc, 61(9):1627-1629.
Victor Bray, MSC, PhD, FNAP is an associate professor at Salus University Osborne College of Audiology in Elkins Park, PA. He can be reached at